Jump to Section:
Well-designed incentive travel can lift sales productivity by roughly 18% and deliver reported ROI figures north of 100%, but most program owners can’t prove it with numbers finance will accept. The fix isn’t a better trip. It’s a measurement plan built before launch: defined KPIs, a real baseline, and a cohort you can compare against. Get that in place first, and the ROI math takes care of itself.
TL;DR:
- Proper ROI measurement requires established KPIs, baseline data, and comparison cohorts from the start, not just post-trip analysis.
- Benefits should focus on incremental gross margin rather than total revenue to produce defensible, finance-acceptable numbers.
- Use a full checklist of costs, including internal admin and add-on rewards, and consider a measurement window of 6 to 12 months for retention effects.
- A shared participant identifier system and upfront data-sharing agreements are crucial to avoid reconciliation issues and improve data access.
- Digital travel certificates that include taxes and fees streamline costs and tracking, reducing noise and making ROI calculations more reliable.
Table of Contents
- What Travel Incentive ROI Actually Looks Like in 2026
- The CFO-Ready ROI Formula: What to Count and Why Gross Margin Wins
- Step-by-Step Measurement Framework: Pre-Launch Through Post-Trip
- Attribution Methods That Actually Hold Up Under Scrutiny
- How to Present the ROI Case to Leadership
- Common Pitfalls and Quick Fixes
- Common Challenges and Pitfalls in Calculating Travel Incentive ROI
- ROI Measurement Differs by Program Type: Sales Rewards vs. Recognition
- Non-Financial Benefits Still Move the ROI Number
- Case Studies in Travel Incentive ROI Measurement
- Publisher Perspective: What Makes Programs Easier to Measure
- A Simpler Way to Run the Numbers on Your Next Program
- Sources
- FAQ
What Travel Incentive ROI Actually Looks Like in 2026
The gap between perceived success and proven success is the whole story here. The Incentive Research Foundation found that a large majority of program owners rate their program’s impact as good or excellent, yet less than a quarter actually track ROI or run a cost-benefit analysis. Very few say they’re highly confident they can isolate the program’s effect from everything else going on in the business that quarter.
That confidence gap matters because the upside is real when it’s measured properly.
- Well-designed programs show sales productivity gains around 18%, with some reported ROI figures exceeding 100%
- Average per-person spend on incentive travel sits near $5,100 heading into 2026
- Third-party incentive suppliers are far more likely than in-house teams to prioritize ROI measurement, with 71% treating it as a core deliverable
Pro Tip: Finance teams trust ranges more than single numbers. If you can only report one figure, you’ll get pushback. Report three: conservative, expected, and optimistic.
A satisfaction score of 4.6 out of 5 is not, underscoring why understanding guest experience metrics matters in measuring program impact. Know which numbers belong in the boardroom deck and which belong in the post-event survey.
The CFO-Ready ROI Formula: What to Count and Why Gross Margin Wins
The formula itself is simple: ROI = (Benefit − Cost) ÷ Cost × 100. The complexity is entirely in what you put on each side of that equation, and most miscalculations trace back to sloppy inputs, not a flawed formula.
On the cost side, build a full checklist rather than relying on the invoice from your travel supplier:
- Airfare, lodging, and ground transport for qualifying participants
- Food and beverage, activities, and program staffing
- Vendor and planning fees, including any third-party measurement services
- Internal administrative time and communications costs
- Gift certificates, prizes, or add-on rewards distributed alongside the trip
On the benefit side, resist the urge to count total revenue growth. The more defensible metric is incremental gross margin generated by the qualifying cohort compared to a baseline period, not top-line sales. That single substitution is often the difference between a number finance accepts and one it rejects on sight.
It also helps to separate three related but distinct metrics: ROI (financial return), ROO (return on objective, like a retention target), and VOI (value of investment, covering brand and morale effects). Report them side by side instead of blending them into one inflated headline number.
Step-by-Step Measurement Framework: Pre-Launch Through Post-Trip
Measurement has to start before the trip is booked, not after it ends. Best-practice guidance from the incentive industry consistently points to the same sequence.
- Pre-launch. Define one primary objective (sales lift, retention, or engagement), pick the KPI that proves it, and pull 6 to 12 months of baseline data for the qualifying group. Select a control or comparison cohort. Negotiate a data-sharing agreement with any third-party vendor before signing the contract, not after.
- Qualification period. Track engagement weekly or monthly using consistent participant identifiers across CRM, finance, and HR systems. Watch for early signals like activation rates or pipeline movement, not just enrollment counts.
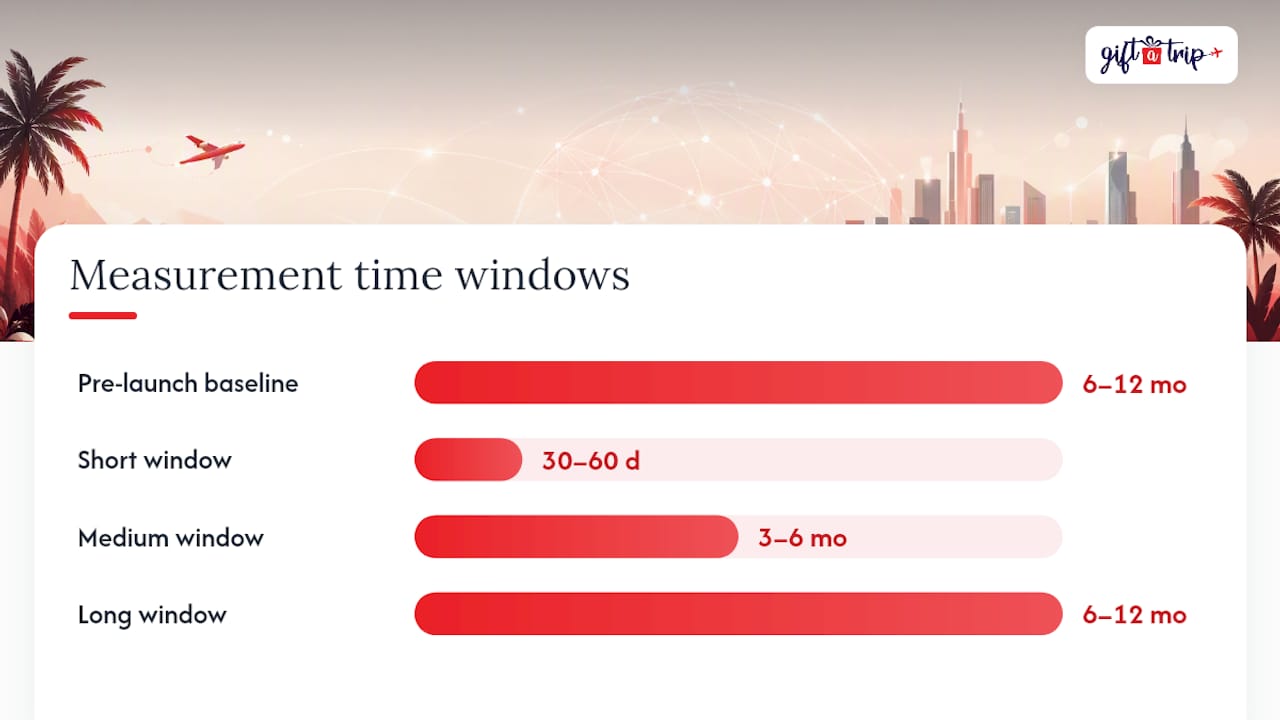
- Post-trip reporting. Run a short-window check (30 to 60 days) for immediate behavior shifts, a medium window (3 to 6 months) for sales and pipeline conversion, and a long window (6 to 12 months) for retention and repeat behavior. Retention effects in particular don’t show up on day 30.
For sales-driven programs, connect CRM and finance data directly. For engagement or recognition programs, pull from your learning management system or HRIS to track retention and internal mobility.
Pro Tip: Build a minimal data checklist before the kickoff meeting: participant IDs, baseline period, control group definition, and the specific finance system field you’ll pull results from. Teams that skip this step almost always end up reconstructing it manually three months later.
If you’re designing the program itself, six proven engagement strategies can shape a structure that’s easier to track from day one.
Attribution Methods That Actually Hold Up Under Scrutiny
Isolating the program’s effect from market noise is where most ROI claims fall apart under questioning. A few techniques give you a defensible answer instead of a guess.
- Use a matched cohort when a true randomized control group isn’t possible. Historical participants matched on region, tenure, and prior performance work reasonably well as a stand-in.
- Apply difference-in-differences analysis to strip out seasonal or market-wide trends that would have happened regardless of the incentive program.
- Convert behavior into dollars conservatively. If engagement scores rose 12%, don’t assume a 12% revenue lift. Run that shift through your actual funnel conversion rate and margin, not a flat multiplier.
- Present a sensitivity table showing ROI at conservative, medium, and optimistic attribution rates rather than a single confident number finance can question.
None of this requires a data science team. A spreadsheet with baseline columns, cohort tags, and a margin calculation covers most mid-size programs.
How to Present the ROI Case to Leadership
Lead with the bottom line, then immediately name the assumption driving it. A CFO reads the headline number first and the caveat second, so put them in that order for them.
- Open with one sentence: “This program returned an estimated 140% ROI based on incremental gross margin from the qualifying sales cohort.”
- Show the math: incremental gross profit, full program cost, and the attribution method used to connect the two.
- Disclose the range, not just the midpoint. A conservative to optimistic attribution table built on 25%, 50%, and 75% attribution rates preempts the “how sure are you” question before it gets asked.
- Attach a short methodology appendix: data sources, baseline window, cohort definition.
- Close with next-step KPIs you’ll monitor over the following two quarters, not just a final verdict on this one.
That structure alone resolves most of the skepticism finance brings to incentive travel spend.
Common Pitfalls and Quick Fixes
Three mistakes account for most failed ROI claims, and all three have straightforward fixes.
- Pitfall: Reporting satisfaction scores as if they were financial ROI. Fix: Keep experience metrics (NPS, satisfaction) in a separate report from the gross-margin calculation.
- Pitfall: Missing costs like internal admin time or add-on rewards. Fix: Use a standing cost checklist for every program, not a fresh list each time.
- Pitfall: Closing the books 30 days after the trip. Fix: Set a mandatory 6 to 12 month follow-up window for retention and revenue metrics.
Pro Tip: Write data-sharing and KPI-tracking requirements directly into your vendor contract. Once the trip is booked, you have almost no leverage to demand better reporting.
Common Challenges and Pitfalls in Calculating Travel Incentive ROI
The single biggest obstacle isn’t math, it’s access. Program owners frequently don’t control the systems holding the data they need. Sales results live in CRM, retention data lives in HRIS, and program spend lives in finance software owned by three different departments with three different approval chains.
A second challenge is timing mismatches. Programs get evaluated on a fiscal calendar that rarely lines up with the natural measurement window a behavior change actually needs. A sales team incentivized in March might not show a revenue bump until Q3, well past the point someone in finance asked for a final number.
A third, quieter problem is inconsistent participant identifiers. If sales data tags people by employee ID and the incentive platform tags them by email, matching the two data sets becomes a manual reconciliation project instead of a query. This alone derails more ROI calculations than any flaw in the formula itself.
Client-side data restrictions compound all of it. IRF’s research points directly to limited data access as a structural barrier to rigorous third-party measurement, which is why the data-sharing agreement belongs in the contract stage, not the reporting stage.
The practical fix across all three problems is the same: agree on a shared identifier system, a shared reporting calendar, and shared data access before the qualification period starts. Retrofitting measurement onto a program that’s already running rarely produces numbers anyone trusts.
ROI Measurement Differs by Program Type: Sales Rewards vs. Recognition
A sales incentive program and an employee recognition program are measured on almost entirely different scales, and treating them the same way is a common source of bad numbers.
Sales-driven programs map cleanly to revenue and gross margin. You have a qualifying threshold, a defined cohort, and a CRM system tracking exactly what each participant sold before and after the incentive period. The math there is closer to a straight financial calculation: incremental gross profit against program cost.
Recognition and milestone programs don’t have that clean revenue link. Their outcomes show up as retention rate, internal mobility, or engagement score movement, which have to be converted into a dollar value through proxy calculations like reduced turnover cost or hiring-avoidance savings. That conversion is inherently softer and needs a wider sensitivity range in the final report.
Customer loyalty programs sit in between. They tie to purchase frequency and lifetime value, but the attribution window tends to run longer since loyalty shifts happen gradually rather than in a single sales cycle.
The practical takeaway: pick your ROI framework based on program type before you start collecting data, not after. A sales program forced into a recognition-style engagement report will look weaker than it is, and vice versa. Programs designed around a clear reward strategy from the outset tend to produce cleaner data because the KPI was chosen alongside the incentive structure, not bolted on afterward.
Non-Financial Benefits Still Move the ROI Number
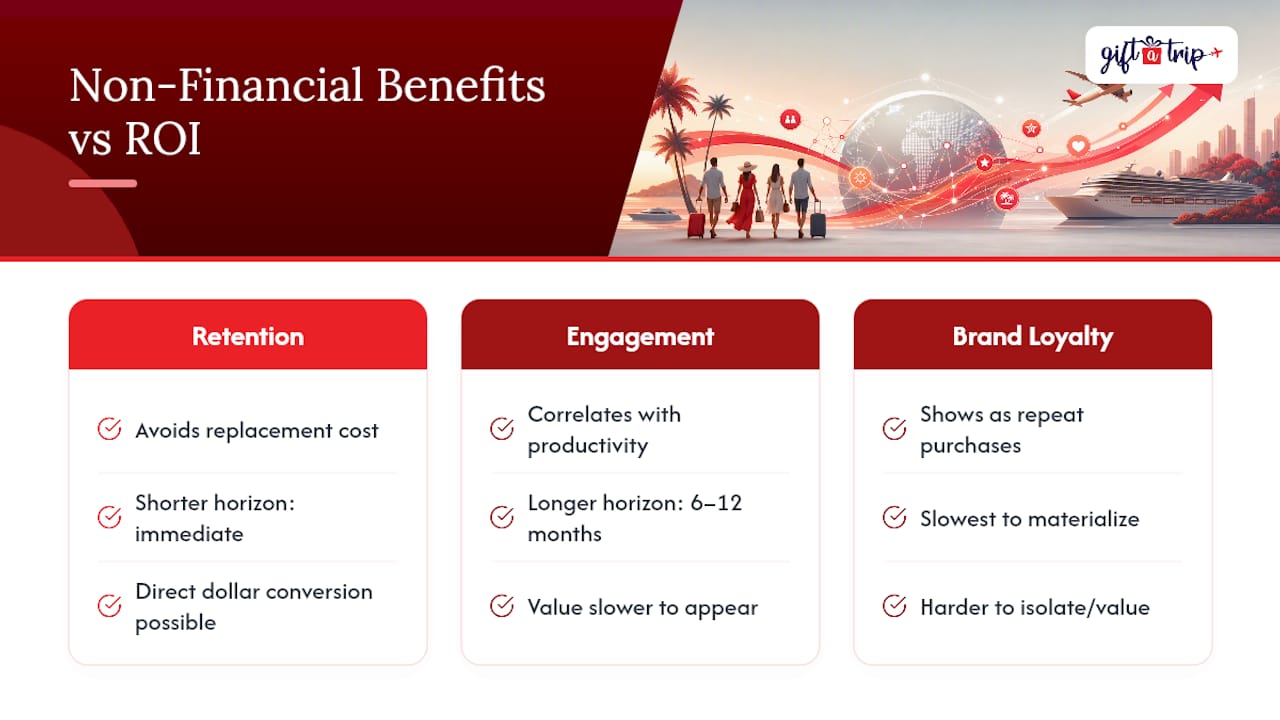
Retention, engagement, and brand loyalty aren’t separate from ROI. They feed directly into it once you convert them to dollars.
A retained employee avoids a replacement cost that typically runs into multiples of that person’s salary once recruiting, onboarding, and lost productivity are factored in. An incentive program that measurably reduces turnover in the qualifying cohort is producing real financial value, even though the initial metric is a retention percentage, not a sales figure.
Engagement works similarly, though the link is longer. Higher engagement scores correlate with productivity and reduced absenteeism, both of which show up in operating costs over a longer window than a typical program report covers, which is exactly why the 6 to 12 month reporting horizon matters more for these effects than for direct sales lift.
Brand loyalty, particularly in customer-facing incentive and loyalty programs, shows up as repeat purchase rate and referral behavior. It’s slower to materialize and harder to isolate from other marketing activity, which is why it belongs in the VOI category discussed earlier rather than folded into the core ROI number.
None of this means treating soft metrics as equivalent to hard financial return. It means building a separate line in the report for non-financial impact, valuing it conservatively where a dollar conversion is possible, and being explicit with finance about which numbers are proven and which are directional. A thoughtfully designed experiential reward tends to generate stronger engagement signals than a cash equivalent of the same value, largely because the experience itself becomes a retention touchpoint long after the trip ends.
Case Studies in Travel Incentive ROI Measurement
The clearest pattern across published incentive travel research isn’t a single blockbuster case. It’s the consistent gap between programs that build measurement into the design and those that bolt it on afterward.
Programs that set a baseline period and a matched control cohort before launch report ROI figures with far tighter confidence intervals than those measuring after the fact. The IRF’s own research on sales-lift outcomes draws its most reliable figures from programs that tracked a qualifying cohort against a comparable non-participant group from day one, not from retrospective estimates built after the trip concluded.
Third-party managed programs tend to produce more defensible ROI reporting than fully in-house ones. Since 71% of third-party suppliers already prioritize ROI as a deliverable, contracts with those suppliers frequently include the KPI tracking and reporting infrastructure that in-house teams would otherwise have to build from scratch.
The common thread in every credible measurement improvement case is the same: sensitivity ranges instead of single numbers, incremental gross margin instead of total revenue, and a reporting window long enough to catch retention effects. Programs that adopted all three saw their finance teams stop challenging the ROI figure and start using it to plan next year’s budget instead.
Publisher Perspective: What Makes Programs Easier to Measure
Programs get easier to measure the moment the reward itself stops generating administrative noise. Digital travel certificates that already package taxes and resort fees remove the ad-hoc reimbursement requests that usually scramble a cost ledger mid-program.
Bulk ordering with individual tracking codes also gives planners a cleaner participant identifier from day one, which solves the reconciliation problem that derails so many attribution efforts. Pairing a distribution guide with a standing budget template turns what used to be a scramble at report time into a five-minute pull from an existing spreadsheet.
— Donovan
A Simpler Way to Run the Numbers on Your Next Program
Most of the measurement headaches covered above trace back to one root cause: reward logistics that generate their own paper trail. Untracked reimbursements, ad-hoc taxes and fees, and manual redemption processes all add noise to a cost ledger that’s supposed to be clean.

Some platforms sell digital and physical travel certificates with taxes and resort fees already built into the price, redeemable across various hotel, resort, and cruise brands. For a program owner trying to isolate incremental gross margin from program cost, that structure matters more than it sounds. There’s no variable fee to estimate after the fact and no reimbursement request to chase down three months into your reporting window. Bulk orders often include individual tracking, which can provide a clean participant identifier that facilitates attribution methods.
If you’re building a measurement plan for an upcoming sales or recognition program, start with the Travel Certificate Distribution Guide for HR and Events to see how tracking and budgeting work in practice, then check current options on the corporate gifting page to price out your next cohort.
Sources
- New IRF research examines best practices and gaps in measurement of incentive travel program impact
- IRF 2026 trends report
- MICEbook commentary on IRF 2026
FAQ
What Is a Travel Incentive?
A travel incentive is a reward, typically a trip, cruise, or resort stay, offered to employees, sales teams, or customers to drive a specific business outcome like revenue growth, retention, or loyalty. Well-designed programs report sales productivity gains of roughly 18%.
What Are the Four Types of Incentives?
Incentive programs generally fall into four categories: sales incentives tied to revenue targets, recognition incentives tied to milestones or performance, customer loyalty incentives tied to repeat purchases, and channel or partner incentives tied to distributor performance. Each type calls for a different ROI framework, since sales programs map to gross margin while recognition programs map to retention value.
Can You Give an Example of Incentive Travel?
A common example is a sales contest where top performers who exceed a defined quota earn an all-inclusive resort or cruise trip, with the company tracking incremental sales from the qualifying cohort against a baseline period to calculate ROI. Employee recognition trips tied to tenure milestones or company-wide performance goals follow the same structure but measure retention instead of sales.
What Are Some Good Incentives to Give Employees?
Travel certificates for resorts, cruises, and vacation packages tend to outperform cash-equivalent rewards on engagement and retention because the experience itself becomes a lasting touchpoint. Digital certificates with included taxes and fees also simplify program administration, which makes tracking cost and calculating ROI considerably easier for the team running the program.
How Long Should You Measure Travel Incentive ROI After the Program Ends?
Track immediate behavior shifts in the first 30 to 60 days, sales and pipeline conversion over 3 to 6 months, and retention or repeat-behavior effects over a full 6 to 12 months. Closing the books too early is one of the most common reasons reported ROI understates a program’s actual impact.